Ask 5 AI models to analyze any price chart
Upload any chart screenshot. Get a Bullish, Bearish, or Sideways second opinion from 5 AI models — with reasons and watch-outs.
3 free analyses · no credit card required
View pricingBULLISH
4 of 5 models agree · next 1 day
- 5 AI models analyze your chart in parallel
- Works with crypto, stocks, forex, indices, and commodities
- 3 free analyses, no credit card required
Upload any chart screenshot
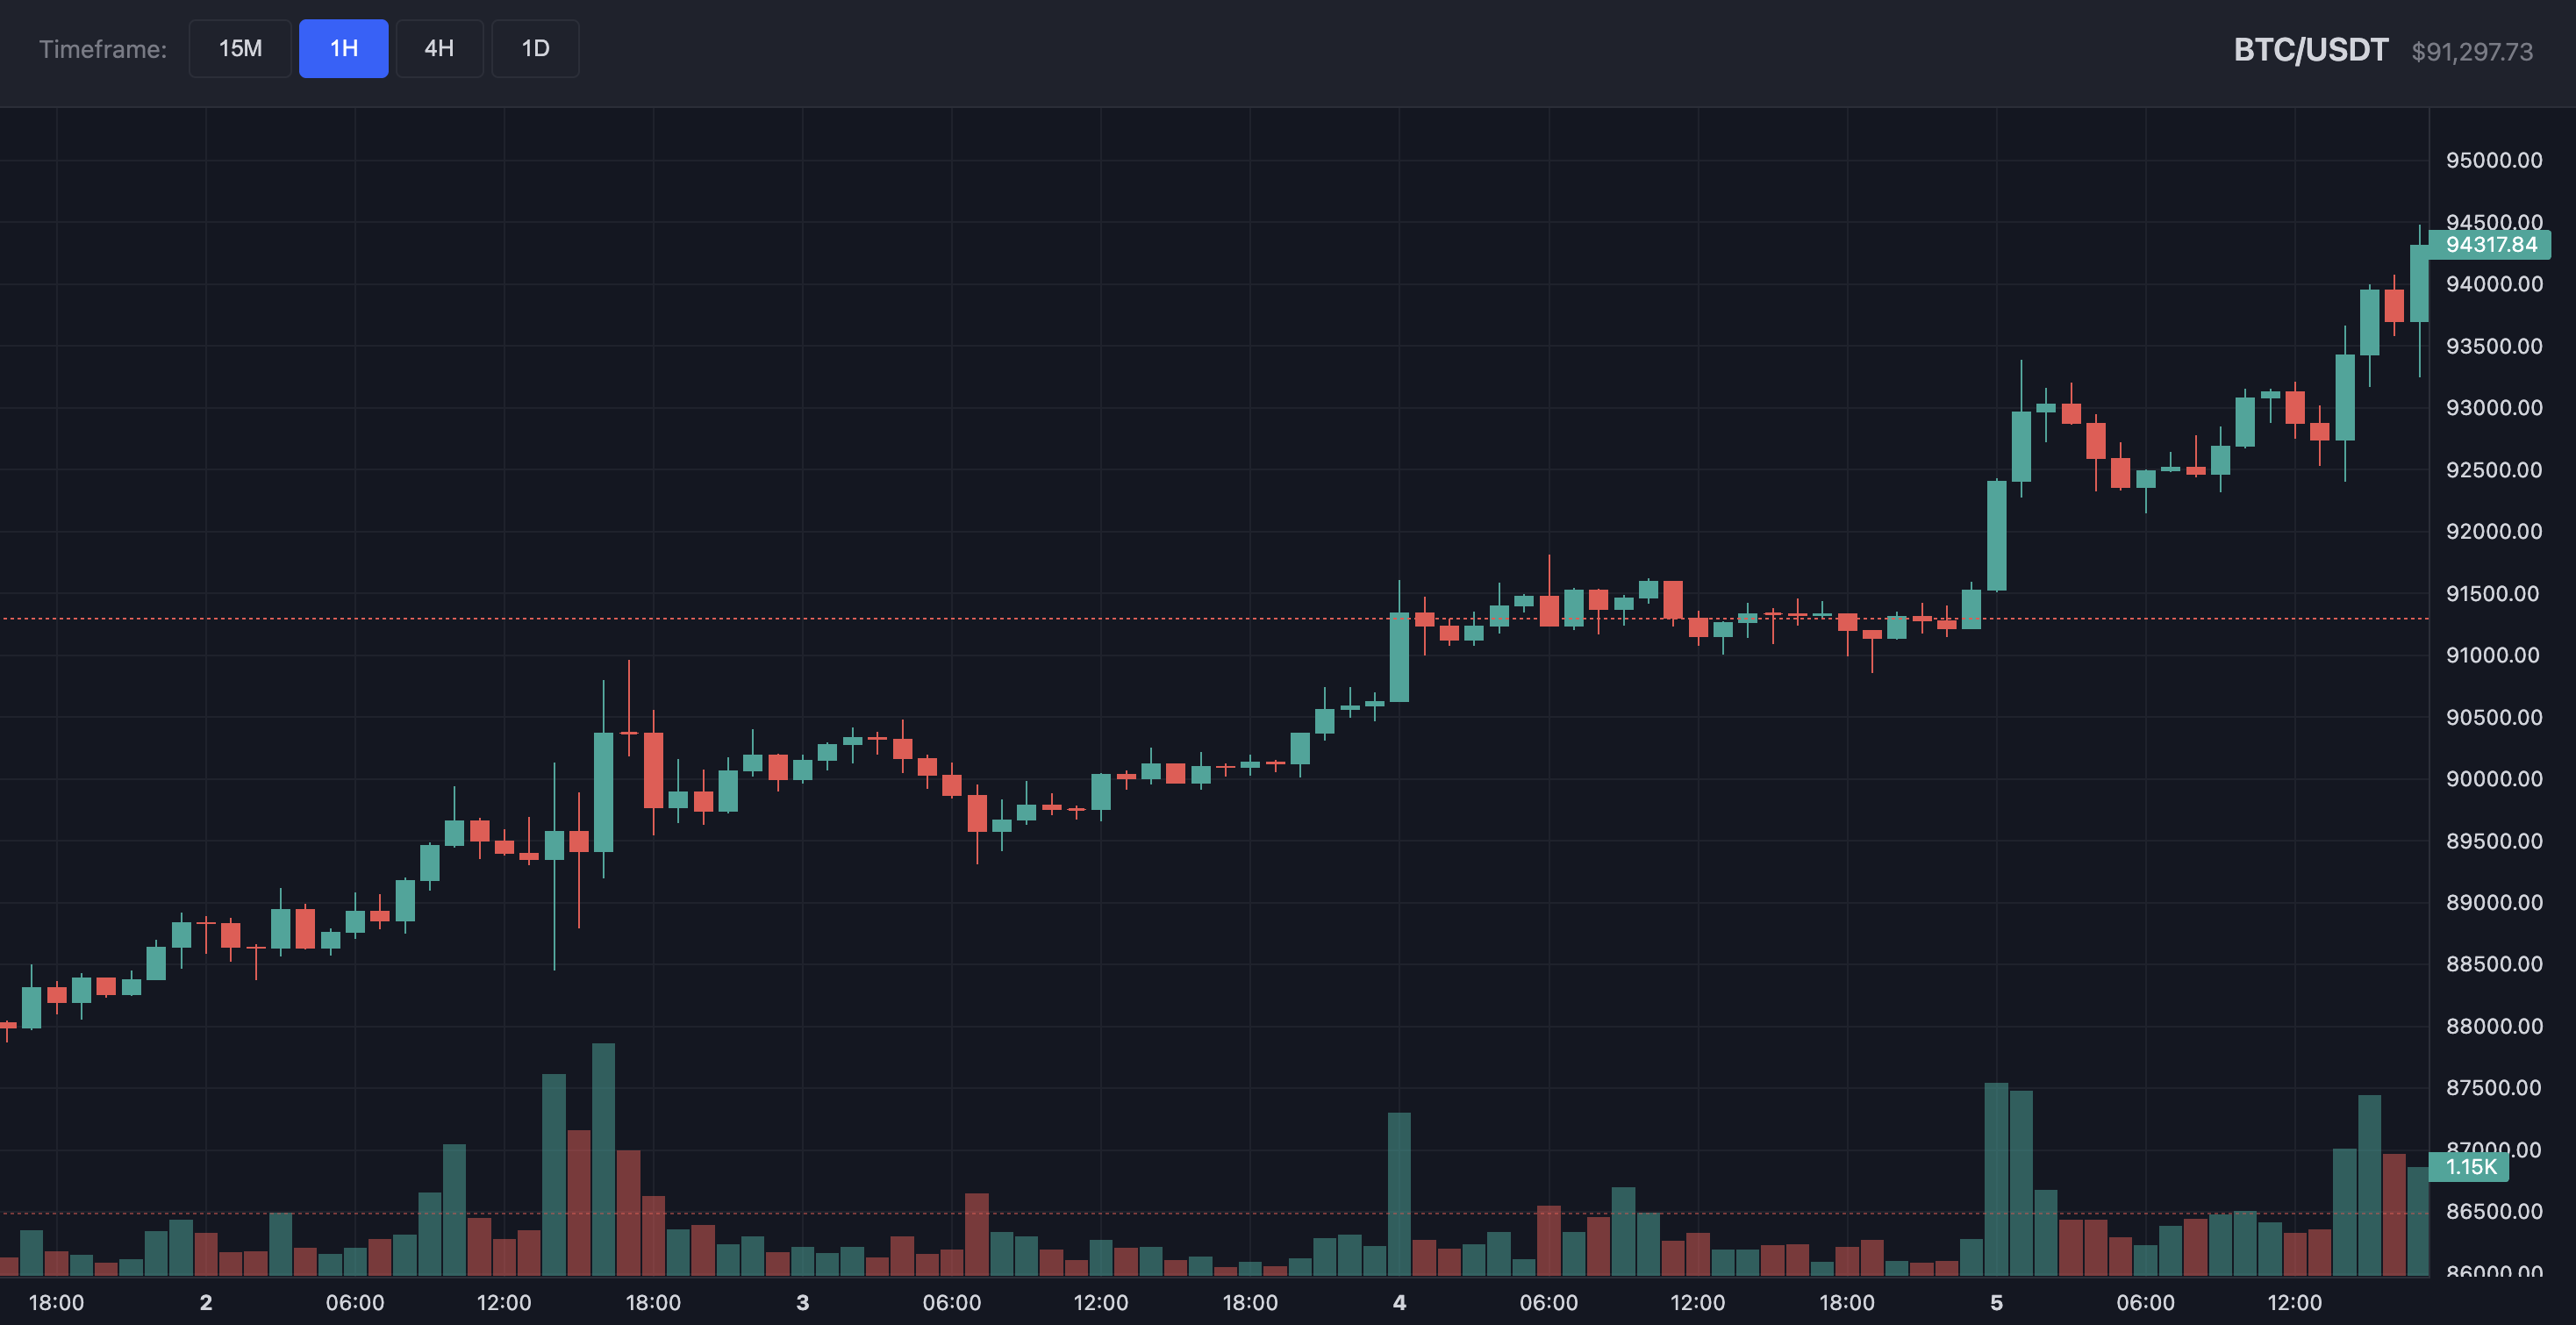
Works with TradingView, broker charts, and other charting tools.
Ask 5 AI models to analyze any price chart
Upload any chart screenshot. Get a Bullish, Bearish, or Sideways second opinion from 5 AI models — with reasons and watch-outs.
BULLISH
Outlook: next 1 day
4 of 5 models voted bullish with 62.4% average confidence.
AI Consensus: Bullish (4 of 5 models)Help
Trader's Summary
Why Bullish
- 1Consistent Higher Highs and Lows: Price structure shows a clear pattern of higher highs and higher lows, indicating sustained bullish momentum.Supported by


- 2Volume-Backed Impulse Moves: Upward price moves are accompanied by increasing volume, confirming buyer conviction.Supported by
- 3Strong Breakout above Resistance: Price has broken above a key resistance zone with follow-through, suggesting a shift in market structure.Supported by
- 4Aggressive Bullish Momentum: Recent candles show strong bullish bodies with minimal wicks, reflecting aggressive buying pressure.Supported by
Watch-Outs
- 1Short-Term Overextension: Price has moved sharply higher in a short period, increasing the risk of a pullback or consolidation.Supported by
- 2Resistance near 94.5k-95k: A cluster of resistance levels sits just above current price, which could cap further upside.Supported by
- 3Risk of Breakout Failure: If price fails to hold above the breakout zone, a swift reversal back into the prior range is possible.Supported by
How it works
Get AI analysis in three simple steps
- 1
Upload your chart
Use a screenshot from TradingView, your broker, or any charting tool.
- 2
Five models analyze it
Each model gives a direction, confidence, reasons, and watch-outs.
- 3
Get the consensus
See the verdict, model agreement, and where the models disagree.
Upload your chart
Use a screenshot from TradingView, your broker, or any charting tool.
Five models analyze it
Each model gives a direction, confidence, reasons, and watch-outs.
Get the consensus
See the verdict, model agreement, and where the models disagree.
Powered by 5 Leading AI Models
Each model analyzes your chart independently. You get the consensus verdict.
Simple, Transparent Pricing
Start free with 3 analyses, then go unlimited with Trader.
Every analysis runs all 5 models: GPT-5.5, Gemini 3.1 Pro, Claude Opus 4.8, Mistral Large 3, and Grok 4.3.
Free
Free
3 free analyses to get started
- 3 chart analyses
- All 5 AI models included
- Full analysis history
- No credit card required
Trader
$29
per month
- Unlimited chart analyses
- All 5 AI models included
- Full analysis history
- Cancel anytime
Pricing FAQ
Ready to analyze your charts?
Get started with 3 free analyses. No credit card required.